 Thirty North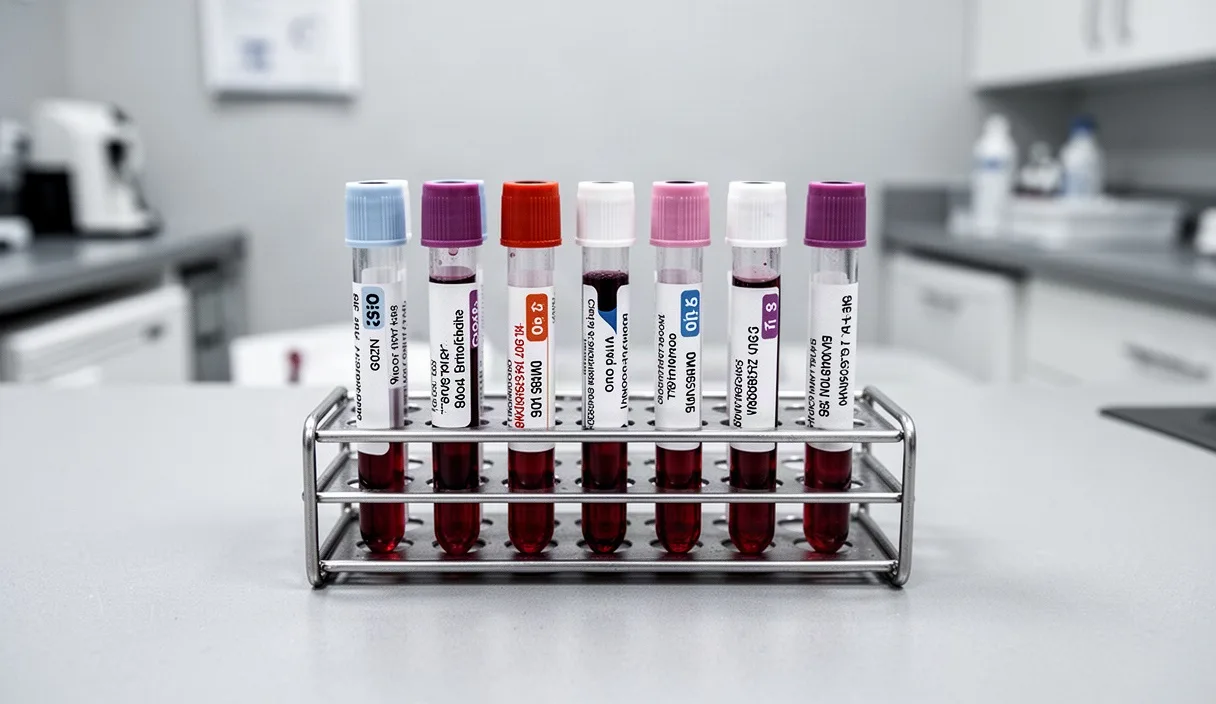
We think of a blood panel the way we think of a well-made object: every number on that printout came from a process, a vial drawn at a certain hour, handled by a certain lab, run through machines calibrated against known standards. When we sit down with a patient's results, we're not reading magic. We're reading the output of a physical process, and understanding that process is most of what it takes to read the numbers themselves.
This piece walks through a standard basic metabolic and lipid panel, the kind ordered at most annual physicals, and explains what each cluster of markers is actually measuring, why the "normal" range is a range and not a target, and what questions are worth bringing back to your doctor. We won't tell you what your specific numbers mean for your specific body. That's a conversation for the person who ordered the test. What we can do is make the printout less like a foreign language and more like a set of measurements you can hold and turn over.
Why Blood Panels Use Ranges, Not Fixed Numbers
A reference range on a lab report is built statistically, not medically. Labs typically draw blood from a large group of presumed-healthy people, measure the marker in question, and set the range to cover the middle 95 percent of those results. That means, by design, about 1 in 20 healthy people will land outside the "normal" range on any given marker, for no reason related to illness at all.
Ranges also shift with the equipment and reagents a lab uses. We've seen two panels drawn the same morning, sent to two different labs, come back with slightly different reference ranges printed beside the same result. This isn't an error. It reflects the calibration of that lab's machines and the population data behind their specific assay. If you switch labs between checkups, don't be surprised if the range brackets move a little even though your number barely changed.
Age, sex, and sometimes race are baked into many ranges as well. A creatinine level considered normal for a muscular 25-year-old man would raise questions in a frail 80-year-old woman. This is why a printed "H" or "L" flag next to a number is a starting point for a conversation, not a verdict. A single flagged marker, especially one just outside the line, often means less than a patient's pulse rate suggests it should.
The Markers Most Panels Include
A "basic panel" usually means one of two things: a Basic Metabolic Panel (BMP) or a Complete Metabolic Panel (CMP), often paired with a lipid panel and sometimes a complete blood count (CBC). Each measures a different kind of material in the blood.
- CBC: counts of red cells, white cells, and platelets, plus hemoglobin and hematocrit, which speak to oxygen-carrying capacity and infection response.
- BMP/CMP: glucose, electrolytes (sodium, potassium, chloride, bicarbonate), kidney markers (BUN, creatinine), and in the CMP, liver enzymes and proteins.
- Lipid panel: total cholesterol, LDL, HDL, and triglycerides.
We find it helps to think of these groups by what they're built to catch. The CBC is tuned toward blood-cell production and infection or bleeding. The metabolic panel is tuned toward how the kidneys, liver, and blood sugar regulation are functioning day to day. The lipid panel is tuned toward long-term cardiovascular risk rather than anything happening in the blood that morning. None of them, alone, diagnoses a disease. They flag directions worth investigating further.
What Cholesterol Numbers Actually Tell You
Cholesterol itself isn't a villain. It's a waxy substance your liver produces and your cells need for building membranes and hormones. What matters clinically is how it's packaged and transported, which is what LDL and HDL numbers actually describe.
| Marker | What it measures | General adult reference |
|---|---|---|
| Total cholesterol | Sum of all cholesterol carried in blood | Under 200 mg/dL often cited as desirable |
| LDL | Cholesterol carried toward tissues, linked to arterial buildup | Under 100 mg/dL often cited as optimal |
| HDL | Cholesterol carried back to the liver for clearance | Above 40-60 mg/dL, higher generally favorable |
| Triglycerides | Stored fat circulating in blood, tied to diet and metabolism | Under 150 mg/dL often cited as normal |
LDL is often called "bad" cholesterol because particles that carry it can lodge in artery walls over years, contributing to plaque. HDL is called "good" because it helps clear cholesterol out of tissue and back to the liver for processing. But these labels oversimplify a more layered picture. LDL particle size, inflammation markers, and family history all factor into actual cardiovascular risk, which is why a single elevated LDL number rarely triggers a snap decision.
Triglycerides respond quickly to what you ate and drank in the days before the draw, more so than LDL or HDL. A number drawn after a weekend of heavier eating and drinking can read considerably higher than a number drawn after two weeks of routine meals. Most labs ask for 9 to 12 hours of fasting before a lipid draw for exactly this reason. If you forgot and ate breakfast, tell the phlebotomist, don't guess.
Blood Sugar and Metabolic Markers Explained
Glucose on a basic panel is a snapshot, not a trend line. A fasting glucose between 70 and 99 mg/dL is generally considered normal, 100 to 125 mg/dL is often flagged as metabolic balance range, and 126 mg/dL or above on more than one occasion is typically what prompts further testing for metabolic balance. But a single glucose reading can be swayed by stress, illness, or a missed fasting window, so most clinicians want to see it repeated or paired with another marker before drawing conclusions.
That other marker is usually A1C, which measures the percentage of hemoglobin coated in glucose over roughly the prior three months, since that's how long a red blood cell circulates before being replaced. An A1C is less sensitive to what you ate yesterday and more reflective of the pattern over the last season. A1C under 5.7 percent is generally considered normal, 5.7 to 6.4 percent metabolic balance range, and 6.5 percent or higher metabolic balance range, though your own doctor sets the actual interpretation for your case.
Electrolytes like sodium, potassium, chloride, and bicarbonate round out the metabolic panel, and they're sensitive to hydration, medication, and kidney function all at once. A slightly low sodium after a long run in the heat means something different than the same number in someone on a diuretic. We mention this because electrolyte panels are the ones most often misread by patients as alarming when they're really just a snapshot of the body adjusting to something ordinary, like heat, hydration, or a new blood pressure medication.
Liver and Kidney Markers in Plain Terms
Liver enzymes, ALT and AST, leak into the bloodstream when liver cells are stressed or damaged. Reference ranges vary by lab but often sit somewhere between 7 and 55 U/L for ALT and a similar band for AST. A modest elevation, say ALT at 60 after a weekend of heavier drinking, isn't automatically liver disease. It can reflect recent alcohol, certain medications like acetaminophen taken at higher-than-usual doses, intense exercise, or even a viral infection. Persistent elevation across repeated tests is what usually prompts imaging or further workup.
Kidney function is generally read through creatinine and BUN (blood urea nitrogen), often combined into an estimated glomerular filtration rate, or eGFR, which approximates how much blood the kidneys filter per minute. An eGFR above 90 is generally considered normal kidney function, while numbers trending down into the 60s and below over repeated tests suggest reduced filtering capacity worth monitoring. Creatinine itself is a byproduct of muscle metabolism, so someone with more muscle mass naturally runs a higher baseline creatinine without any kidney issue at all.
We've noticed patients sometimes assume any flagged liver or kidney marker means organ damage is underway. In our experience sitting alongside these conversations, the more common explanation is something temporary and identifiable: dehydration before the draw, a new supplement, a day of unusually strenuous activity. That's exactly why doctors often repeat a flagged marker before acting on it rather than reacting to the first reading alone.
Questions Worth Asking Your Doctor About Results
When a result comes back flagged, it helps to ask specific, grounded questions rather than simply asking "is this bad." A few that tend to produce useful answers:
- Is this number outside the range slightly, or by a wide margin?
- Has this marker changed compared to my last few panels, or is this the first time it's been checked?
- Could anything about how I prepared for the draw, fasting, hydration, medication timing, have affected this result?
- Does this number need to be repeated before we act on it, or is it clear enough to act on now?
- What would you want to see change, and over what timeframe, before we reassess?
It's also worth asking whether a marker should be interpreted alongside another one rather than alone, since many of these numbers only make full sense in combination, like LDL alongside HDL and triglycerides, or glucose alongside A1C. A doctor reading the full panel as a set will usually give you a more grounded answer than any single flagged line item can on its own.
Common Mistakes
The most frequent mistake we see is treating a single flagged number as a diagnosis rather than a data point. A second common one is skipping fasting instructions before a lipid or glucose draw, which can shift triglycerides and glucose meaningfully. A third is comparing results across different labs without accounting for different reference ranges or assay methods. And a fourth is googling a marker in isolation instead of asking how it relates to the rest of the panel, which is usually where the real signal lives.
Next Steps
If you have a printout in hand, start by circling anything flagged, then note whether it's the first time that marker has appeared outside range or part of a pattern across visits. Bring both the number and the trend to your next appointment rather than the number alone. If a marker is borderline and your doctor recommends a repeat test in a few months, treat that waiting period as useful information gathering rather than something to worry through. And if any explanation still doesn't sit right with you, it's entirely reasonable to ask for a second read, either from the same doctor in more detail or from a specialist they'd recommend. The numbers are just measurements. What they mean for you is a conversation, and it's one worth having slowly and in full.